- Some comments and pictures from the ELogBook => The 2011 LHC scrubbing run started on Tuesday 05/04/11 night.
- Some other PRELIMINARY measurements not in the ELogBook:
- Schottky from Tatiana Pieloni et al. => Example of data analysis: TIMBER_DATA_b1.csv and TIMBER_DATA_b2.csv, and Python code: sch.py.
- python2.5
sch.py -f Fill1674/TIMBER_DATA_b2_b.csv -b2 -t30 80 -a -k524 -o
What you could need....
-
setenv PATH /afs/cern.ch/eng/sl/lintrack/Python-2.5/bin/
- setenv PYTHONPATH /afs/cern.ch/eng/sl/lintrack/Python_Classes4MAD/
- Some results: 1.
- Bunch length evolution by EM. These plots were made by taking the data from Timber (TIMBER_DATA_BunchLengths2.csv and TIMBER_DATA_FilledBuckets2ndCase2.csv) and reading with this Mathematica notebook (see also comments inside).
- ADT by Riccardo De Maria et al. (procedure to collect and save data, data files and Python code for data analysis).
- Some interesting data: 1, 2, 3, 4, 5, 6, 7, 8, 9, 10fullmovie.
- Calibration for ADT pickups from Wolfgang Hofle (with only 2 points) => mm for the pick-ups and the digital readings:
- beam 1: https://ab-dep-op-elogbook.web.cern.ch/ab-dep-op-elogbook/elogbook/eLogbook.php?shiftId=1033100.
- beam 2: https://ab-dep-op-elogbook.web.cern.ch/ab-dep-op-elogbook/elogbook/eLogbook.php?shiftId=1033120.
- For the beta functions at the damper pick-ups there is a table in this paper http://hb2010.web.psi.ch/proceedings/papers/mopd51.pdf (to be checked if optics did not change. Normally 3.5 TeV and 450 GeV is the same in IR4).
- On 09/04/11, we increased the gain of the ADT from 0.18 to 0.26 (at 08:50) and to the maximum 0.3 (at 09:50). It seems the damper damped the oscillations at the middle and end of the batch but not at the beginning. Info from GA: WolfgangH said that the electronics of the damper pick-ups was saturating on the first bunches with larger intensity. This COULD explain the reason for a longer damping time at the beginning of the 72 bunch trains taking into account that at the edges the gain of the feedback is lower. GA asked to reduce the intensity of these bunches at the beginning (indeed of the whole 12 bunches of the first PSB ring (ring 3).
- Matlab script to postprocess both the data from Riccardo's application and Verena's multiturn from Benoit Salvant => Some results: 1, 2.
- BSRT:
- Procedure by Christian Hansen and some plots (also in the ELogBook).
- Limitations (from Federico Roncarolo): BSRT data during the ramp are not reliable since the system is passing from UND to D3 light + filters inserted to attenuate more the light. This is not done smoothly and the resultant beam sizes suffer of large statistical and systematic errors. Also consider that over the week-end (16-17/04/11) we had problems with the B2 steering of the light through the telescope and there are periods (even at constant energy) with faulty values.
- Some filling schemes:
- filling_schemes_50ns (GA).
- filling_schemes_75ns (GA).
- EcloudMeasurementsWith2BatchesOf50nsVsBatchSpacing (EM).
- filling_schemes_50ns_withBSRT_05042011.
- filling_schemes_50ns_09042011.
- Delta T without ecloud (form Walter Venturini Delsolaro) that we would have in the 5 cells calibrated with 600 bunches and 1.2E11 p/b due to the image current and of the constant contributions of heat (heater + supports).
- Analyses of bunch shortening vs. FBCT by Nicolo Biancacci.
- FBCT analysis for bunch intensities close to ultimate(!) by Nicolo Biancacci.
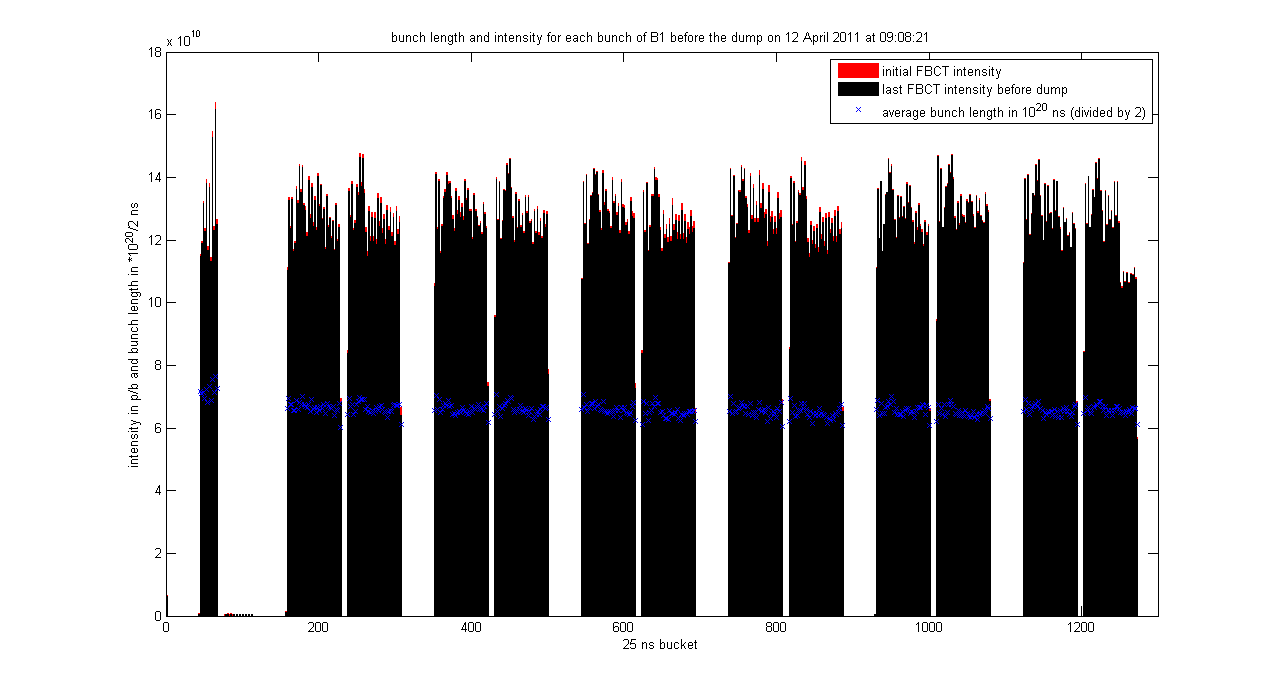
- Bunch length and intensity for each bunch on 12/04/11 by Benoit Salvant.
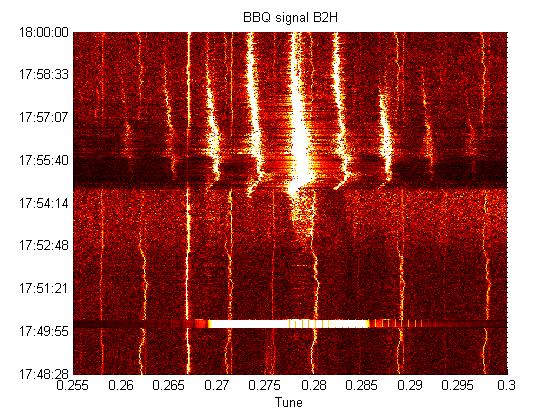
- BBQ plot when we had the big losses all over the bunches following the 11th injection on 10th April 2011 around 17.50 by Nicolo Biancacci.
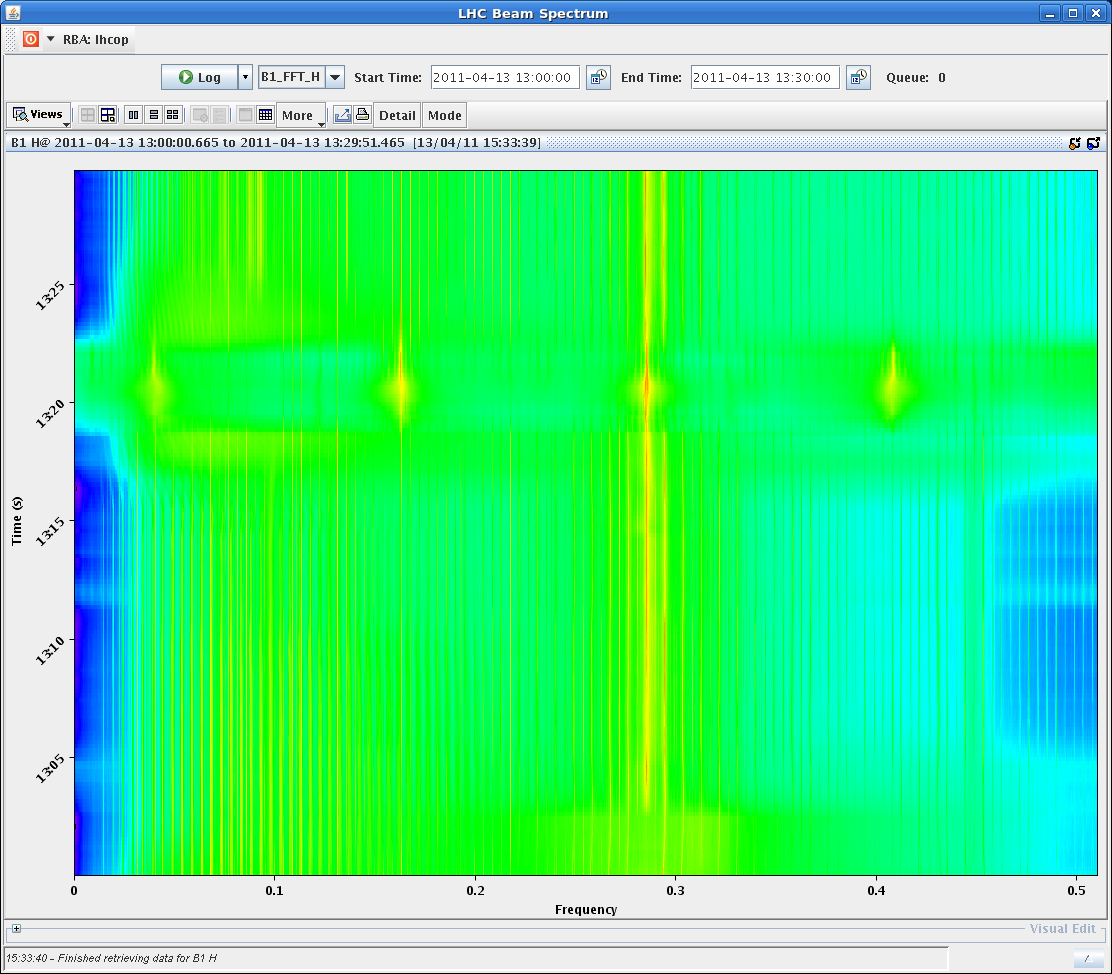
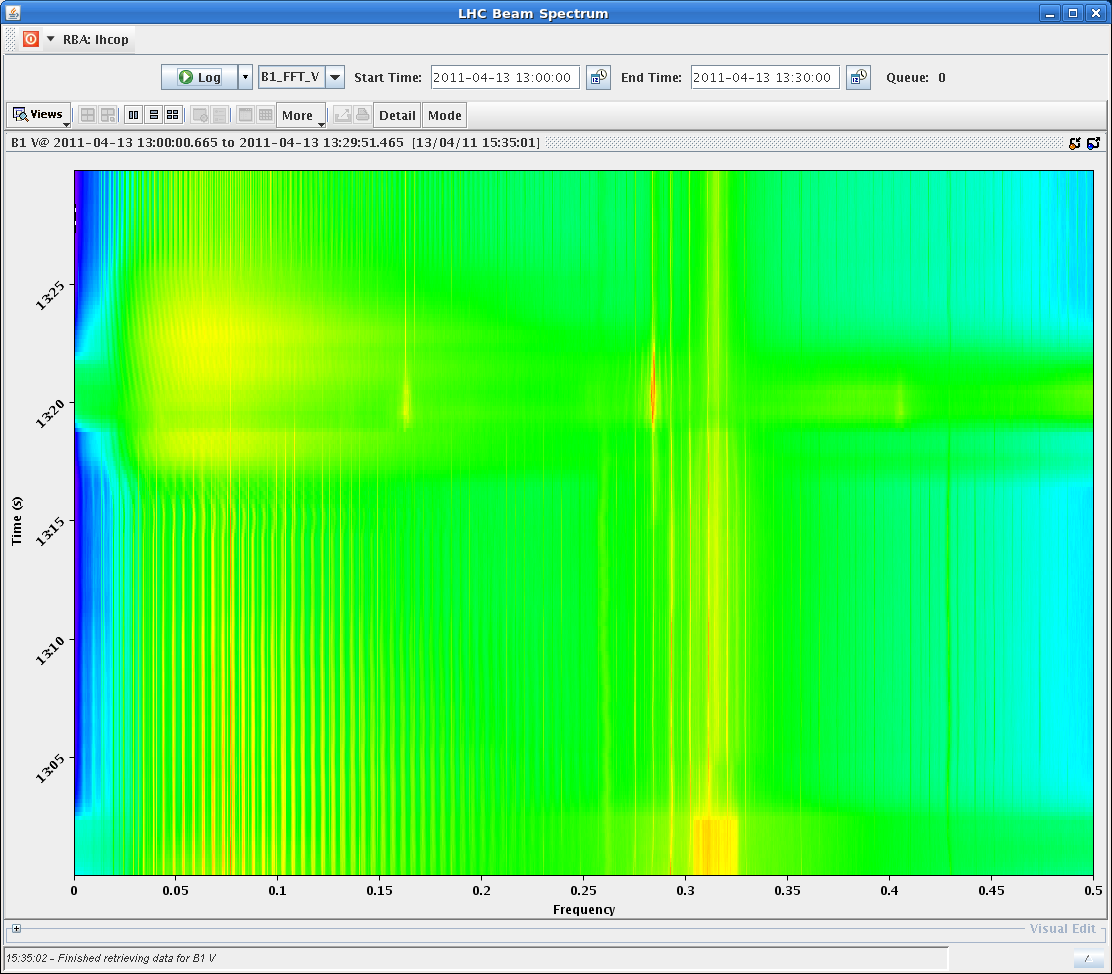
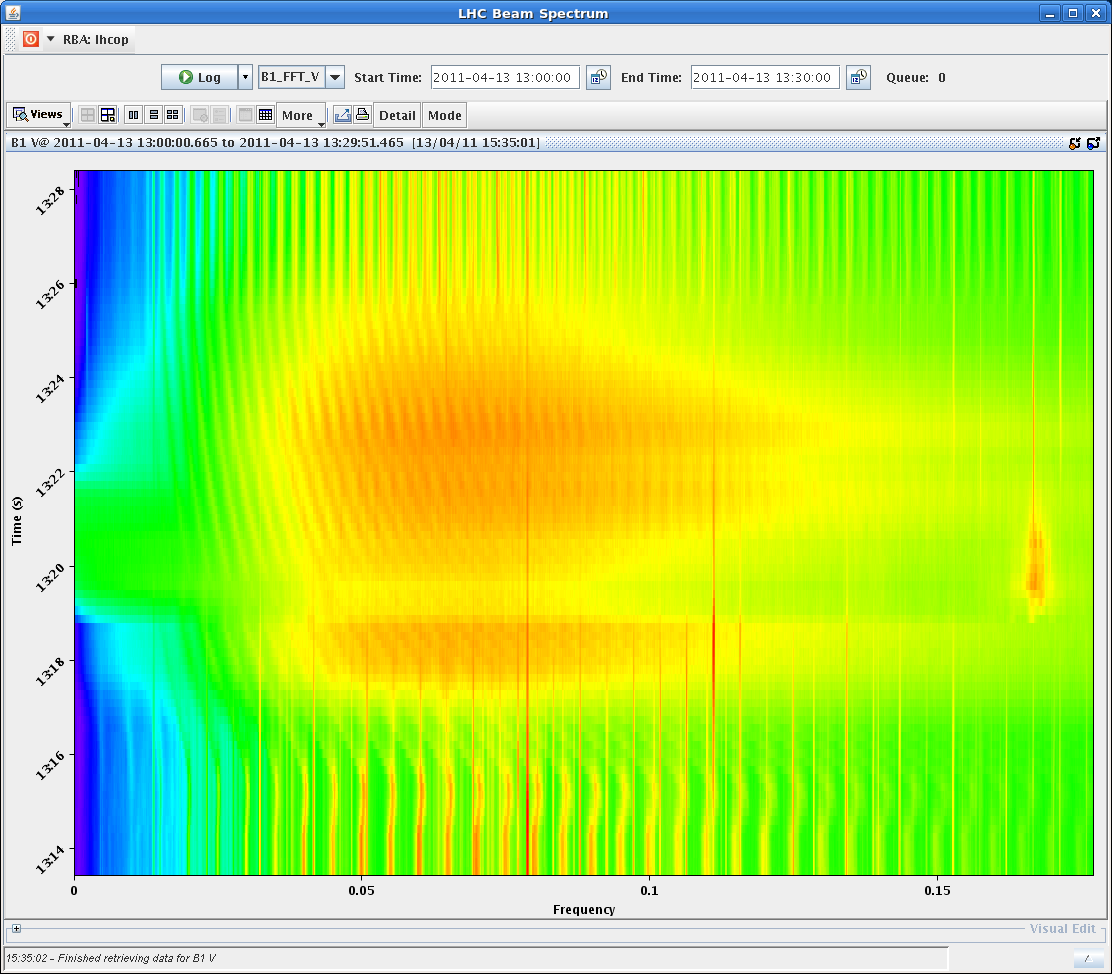
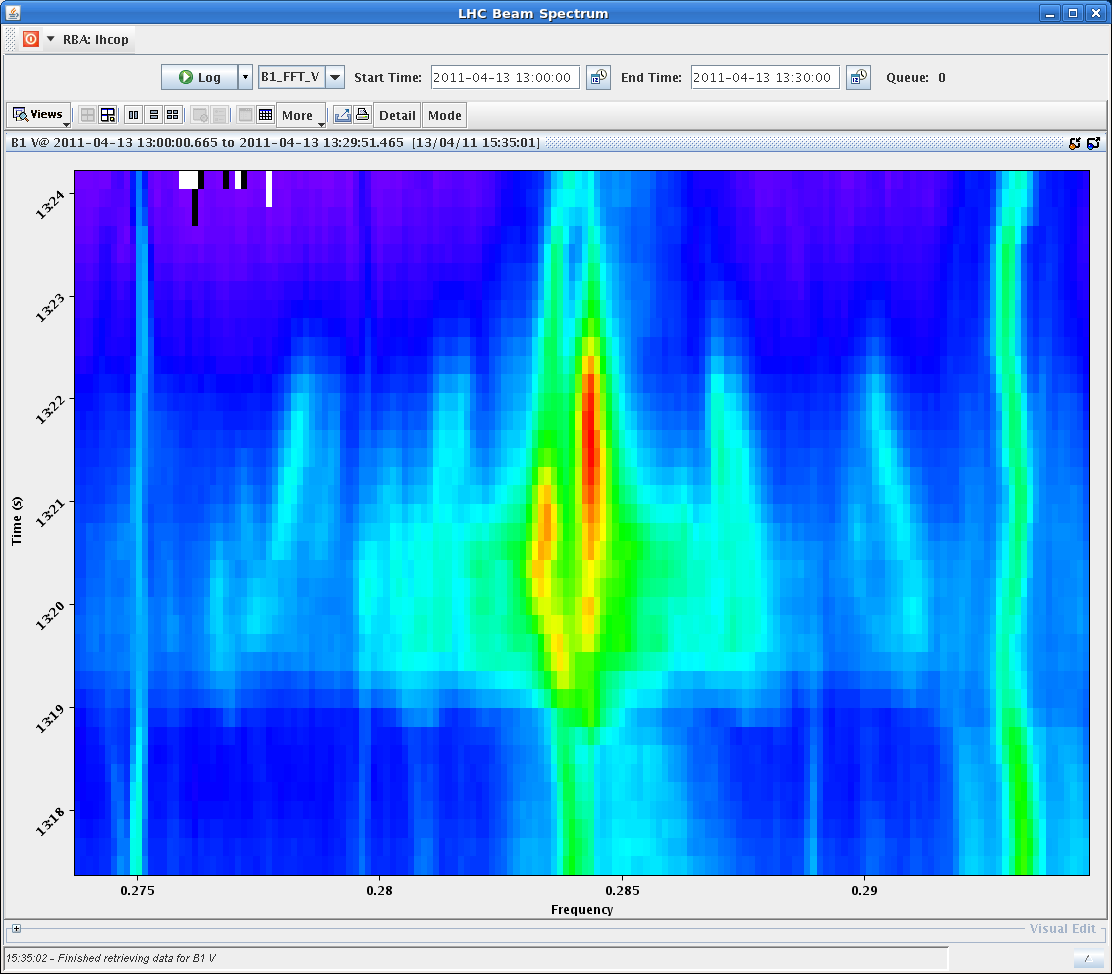
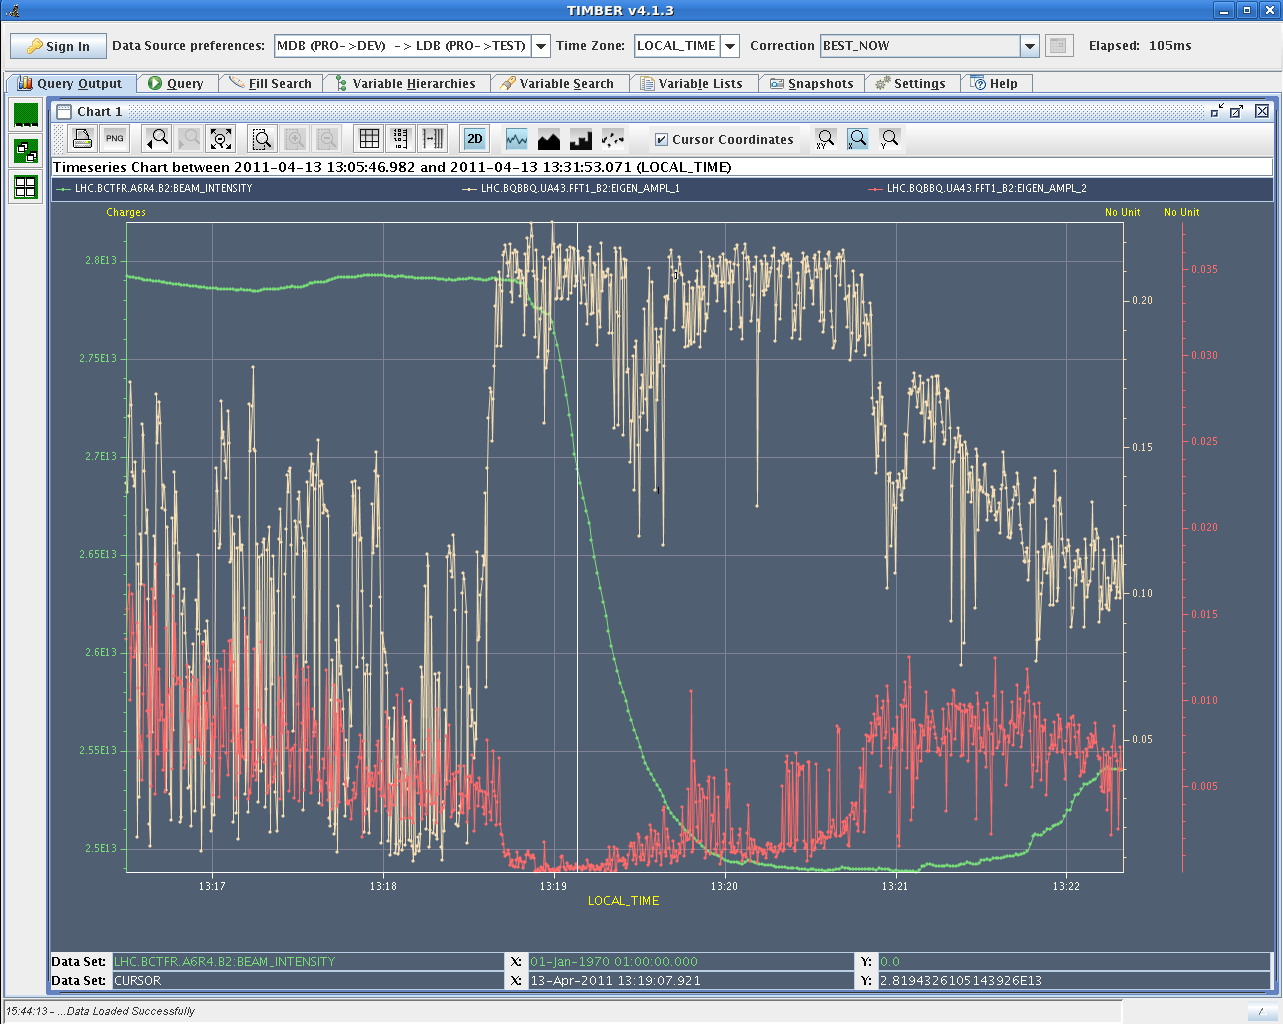
- (Clear) coupled-bunch motion in H observed on Wednesday 13/04/11 around 13:17 where some losses on B2 were observed around 1.2 TeV (see ELogBook where all the images shown below are also present):
- Some images produced by Hannes Bartosik for the coupled-bunch motion=> Some plots generated from the ADT data. The FFTs correspond to single bunches (scanning over 8 bunches). The position movies correspond to the whole bunch trains over 73 turns (note that the 0 in the horizontal axis does not correspond to the beginning of the train due to the way the acquisition is taken). Strong coherent motion along the train in horizontal plane and especially in B2 (at that point): 1, 2, 3, 4, 5, 6, 7 and 8.
- Some plots produced by Ralph Steinhagen => initially mostly longitudinal activity until about 13:19:30, then strong (saturating the BBQ) in H oscillations around 0.28... Two (?) tune lines seem to appear, rise-time of about 6 seconds: 1, 2, 3, 4 and 5.
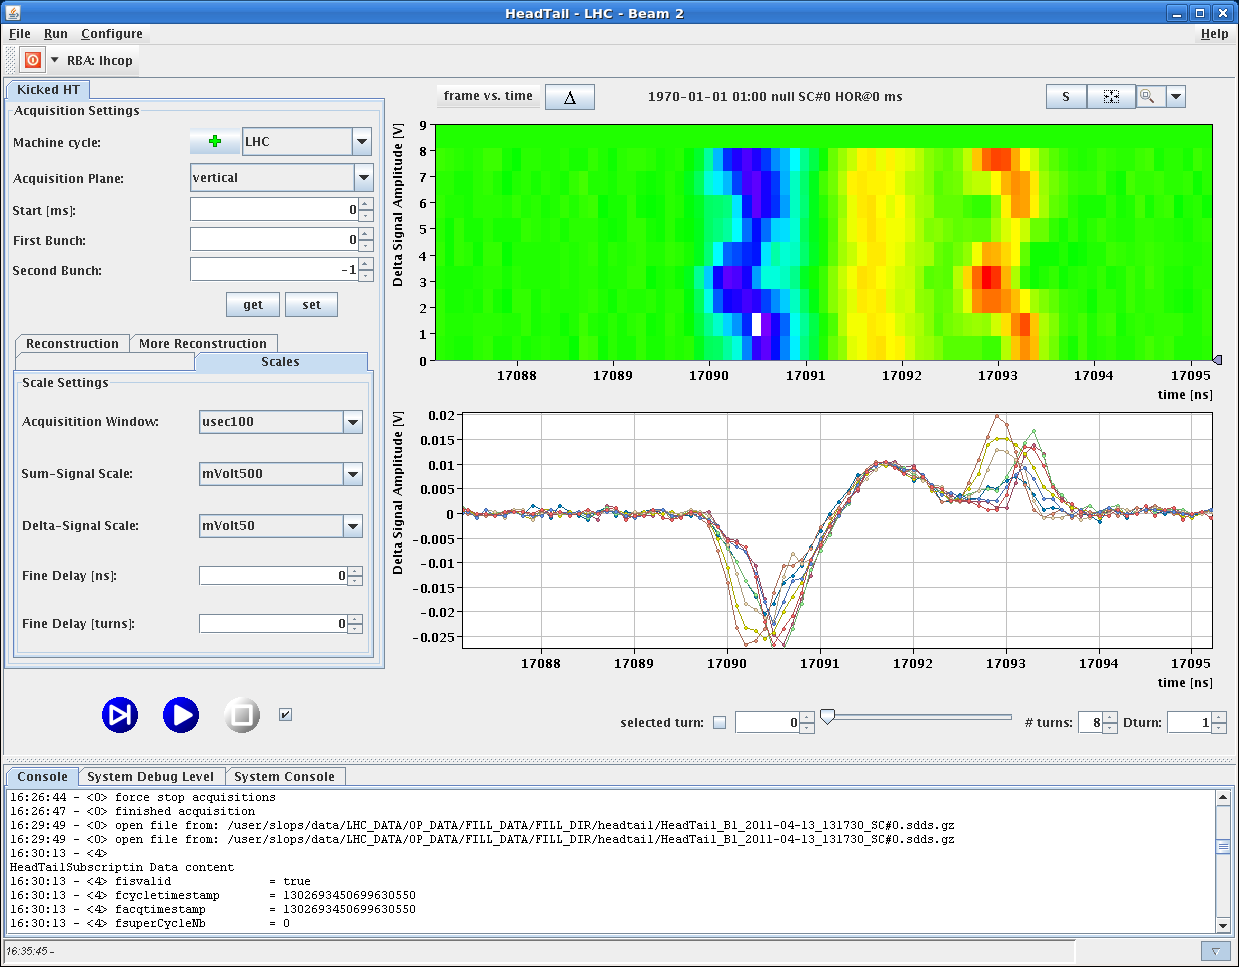
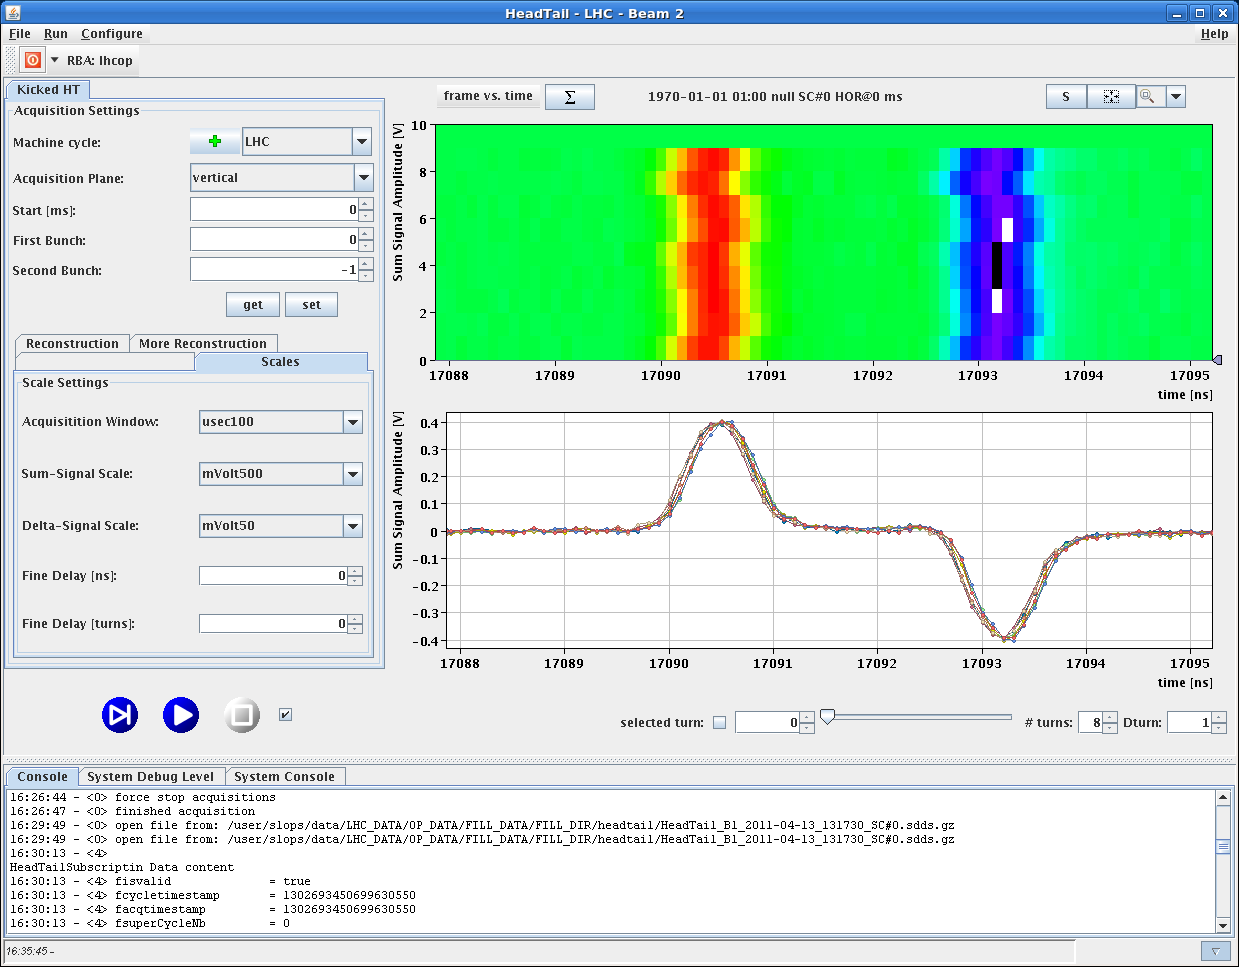
- Some images from Benoit Salvant looking at the intra-bunch motion on some bunches with the HEADTAIL monitor => Seems that a head-tail mode |m| = 1 is observed (1 node with several superimposed traces) and that the longitudinal signal was stable: 1 and 2. Remark: It is said vertical plane on the picture, is it an error or really the vertical plane?
- Some BGI data during the scrubbing run by Mariusz Sapinski => In the vertical image of the beam profile we see a structure which is very pronounced at the beginning of the fill (1), which disappears at the end of the fill (2).
- Some measurements just after the 2011 LHC scrubbing run:
- Summary of the heat load measurements with the corresponding filling schemes as analyzed by Walter Venturini Delsolaro. Laurent and Walter are checking the analysis. What is a bit strange is the systematic higher load in two cells. What is the heat load that we would expect for the synch light?
- We should try and look at the emittances through the ramps that we had on 16/04/11 as it seems that we had some electron cloud activity in the arcs => Do we see some transverse emittance blow-up?
- Some analysis by Christian Hansen: http://chansen.web.cern.ch/chansen/EURONU/BSRT/bsrtScrubbApril11.html#april16.
- GA is interested in particular in the evolution through the trains to see whether there is some systematic effect => Have a look to the data collected during the week-end and in particular the ramp starting at 13:53 on Saturday, and the one at 11:30.
- Did we take some data during the night when we went in collision for the second time with 2 trains of 228 bunches? During last week-end (16-17/04/2011) it was tried to go in collision with trains of 72 bunches and when we went in collision we lost quite some beam and get a beam dump. It would be interesting to see what has been logged and understand what is happening in such a case.